Performance in an open-world Unreal Engine 5 game, Part 1: Engine defaults and build configuration
Getting our open-world game to meet our performance goals took sustained work across production, much of it while the game was live, as we continued to work toward the console release. The console version is on Xbox Series X|S and PlayStation 5.
 Samson, the player character, with the city skyline behind him. Everything in that skyline has to stream, simulate and render inside a 16.7 ms frame.
Everything described here is in the shipping game as of writing. We shipped with a modified version of Unreal Engine 5.7. We give savings as rough magnitudes instead of exact numbers. Your content will produce different numbers, but hopefully our experience will help.
How we got there
We had spent a considerable amount of time working on performance when the PC version was released, and the reception was pretty rough. PC, of course, is a moving target. We saw that a lot of players did not meet the minimum spec of the game, and most of the time they were CPU bound. At the time of release there was also a nasty driver bug in one of the latest releases of one of the major GPU drivers that caused horrible CPU overhead on GPU calls when the computer had been running for more than a day.
Everything in this article is what we did after the obvious performance work. That means going through Epic’s own material under Testing and Optimizing Your Content and making sure the content itself was well optimized. The most useful pages for us were the real-time rendering and profiling and configuration hubs, the Common Memory and CPU Performance Considerations page, and the Lumen and ray tracing performance guides. If you have not done that yet, do it first.
There was no heroic optimization sprint at the end of the project. Performance was worked on continuously throughout production, with a weekly meeting to review the metrics (frame-time percentiles from automated soak runs, hitch counts, memory headroom) and decide where to dig next. Almost nothing here was worth more than a millisecond on its own, and most wins were a few tenths or less. Stacked steadily over time, they took the target console to over 80% of frames at 60fps.
Our frame-rate problem was almost entirely game-thread bound: hundreds of NPCs, simulated traffic, world-partition streaming, and physics all competing for 16.7ms. The article is in four parts:
- Part 1: Engine defaults and build configuration. What Performance mode runs, then the config and toolchain wins that any UE team can evaluate in a week: link flags, device-profile audits, GC cadence, frame pacing. Ends with a table of the engine defaults and settings discussed across the four parts.
- Part 2: Simulating a city on a 16.7ms budget. The systems we built to make our world affordable, and what we learned running them: cell streaming, spirits, fixed-step physics, rate capping, invisible physics, pooling, spawn cost and batched ticking.
- Part 3: Keeping the work inside the frame. The budget system and its failure modes, garbage collection, significance and the animation budget, streaming spikes, and work whose output was never used.
- Part 4: The process: experiments and the weekly meeting. The ten rules that kept unproven wins out of the earlier parts, and the weekly meeting that kept performance from drifting back.
Every default value in Unreal, and especially every value in the stock platform device profiles, is a decision someone at Epic made for a different game. The defaults are also chosen to make things work with as few problems as possible, which is often the opposite of what you need for performance. For an open-world game a good starting point is the City Sample demo, but even that is a demo and not a shipped game.
Some of our largest wins involved no algorithmic work at all. We found a default that was wrong for us, measured, and changed one line.
Performance mode settings
The console version ships two modes: Quality mode at 30fps and Performance mode at 60fps. Each is a device profile chained on top of the platform’s base profile. Performance mode is mostly Epic’s stock 60fps console profile, and the rest of Part 1 is about the lines we changed in it.
The same in both modes. The scalability groups for view distance, textures, shadows, effects, foliage, shading, landscape and post-processing are all at Epic (level 3). Material quality is High, and we strip every other material quality level at cook. Both modes use Lumen global illumination with hardware ray tracing, virtual shadow maps, and TSR with dynamic resolution upscaling to a 4K output.
What Performance mode gives up:
- Reflections. Lumen reflections are off (
r.Lumen.Reflections.Allow=0) and reflections fall back to screen space, water included. Quality mode keeps hardware ray-traced Lumen reflections. - Global illumination runs one level lower (
sg.GlobalIlluminationQuality=2), so indirect lighting is coarser and updates less often. PlayStation 5 Pro takes it back to level 3. - Volumetric fog, subsurface skin shading and ambient occlusion run at reduced resolution, and the virtual shadow map filtering is lighter. These are Epic’s own adjustments in the stock 60fps profile, and we kept them.
- Dynamic resolution works harder. The internal resolution scales between 40 and 85 percent of 4K, so 864p to 1836p, against a 16.66 ms GPU budget with 3.5 percent headroom. Quality mode has twice the GPU time per frame, so it sits higher in its range.
- Animation quality drops from High to Medium. Our own animation quality cvar sets the animation budget allocator’s per-frame budget (Part 3, §17): 3.5 ms at High, 2.5 ms at Medium. Less important characters have their update rate reduced sooner.
- Game-thread budgets are smaller. The shared frame budget for streaming and simulation (Part 3, §15) is 2.5 ms at 60fps and 8 ms at 30fps. Async loading gets 1 ms per frame instead of 2, and the physics-state creation budgets drop from 6/7/8 ms to 3/4/5 (Part 3, §19). Each 30fps frame is twice as long, so Quality mode can spend more of it loading the world in.
- Frame pacing uses
r.GTSyncType=2withrhi.SyncSlackMS=20(§3), and the ray-tracing culling radius and texture streaming pool are pinned over the stock profile’s values (§1).
1. Audit the stock device profiles
A device profile is not a single file. At boot the engine merges, in order, at least these layers for a console platform:
Engine/Config/BaseDeviceProfiles.ini(vanilla, all platforms)Engine/Platforms/<Platform>/Config/Base<Platform>DeviceProfiles.ini(vanilla, ships with the engine)<GameName>/Config/<Platform>/<Platform>DeviceProfiles.ini(ours, mostly+CVars=appends)
The vanilla platform file is where the profile chain is wired. Every BaseProfileName= link lives there, and our overlay only appends cvars into sections Epic already defined. On top of the merge, every cvar write carries a priority. A [SystemSettings] line in DefaultEngine.ini is SetBySystemSettingsIni, and any device-profile line is SetByDeviceProfile, which outranks it. So a value in your project’s Engine.ini cannot win against a value in any device profile in the chain, including the ones Epic ships.
While working on the console version, a sampling profile showed a few percent of all CPU going into ray-tracing scene building, far more than our settings should produce. The engine’s stock 60fps console device profile pushes r.RayTracing.Culling.Radius to 20000, which overrides the 10000 in our DefaultEngine.ini. Twice the radius is eight times the culling volume, so the RT scene covered eight times the volume we had intended. The same audit found the stock 60fps profile setting the texture streaming pool to 2048 MB where we had chosen 500 MB.
On every engine upgrade, diff the shipped Base<Platform>DeviceProfiles.ini against your assumptions, and then verify what each cvar resolves to at runtime. The device profile manager logs one line per cvar it applies, Pushing Device Profile CVar: [[Name:OldValue -> NewValue]], and the console manager logs a was ignored as it is lower priority message whenever a write loses to a higher priority. The value in the ini you wrote is not always the value the game runs with, and the log is the only place that shows the resolved value.
2. GC threshold
 Driving fast through downtown is the case that exposed the World Partition GC threshold: cells stream out behind the car faster than the timer-driven GC would ever collect them.
When driving fast through the open world we saw the game stutter on a full GC reachability analysis, a double-digit-millisecond block on the game thread. It happened several times a minute while driving, even though our GC timer (gc.TimeBetweenPurgingPendingKillObjects) is set to about 61 seconds. Several passes a minute against a once-a-minute timer meant something else was forcing GC.
World Partition force-runs GC whenever more than N streamed-out levels are pending purge. The default for wp.Runtime.LevelStreamingContinuouslyIncrementalGCWhileLevelsPendingPurgeForWP is 64, which is easy to exceed while driving across a streamed world. We raised the threshold to 256. We kept it below the “never fires” range so the path survives as a safety valve for real pile-ups.
Measured over matched windows of our seeded driving soak, the result was roughly three-quarters fewer reachability hitches, and a similar reduction in unsliceable game-thread time per minute. Per-pass cost was unchanged, since reachability walks the live object graph and not the accumulated garbage. Peak physical memory also came out hundreds of megabytes lower, which we had not expected. Retained object count rose slightly, but total GC churn per minute fell by more than half, and churn was the larger term.
Run with gc.DumpAnalyticsToLog=1 and compare the actual GC cadence against gc.TimeBetweenPurgingPendingKillObjects. If GC fires far more often than the timer, something is forcing it, and it is worth finding out what.
3. Frame pacing: GTSyncType and SyncSlackMS
In Unreal Insights we saw frame-length “stalls” charged to an empty engine scope at frame start, on hitch frames only. Pausing the game made them vanish, which looks like a game-thread cost. But the GPU queue was busy the whole frame.
On console we run r.GTSyncType=2, which starts the game thread relative to the predicted vblank instead of letting it free-run ahead of the RHI thread. That is good for latency and smoothness, but it shortens the pipeline. With the default settings the game thread is released only 10 ms before the vblank, so game-thread and GPU work partly serialize instead of overlapping. On heavy frames, frame time becomes GT + GPU (two ~16ms halves adding up to a 30ms frame) instead of max(GT, GPU). Pausing collapses GT work to nearly zero, so the frame recovers.
We kept type-2 pacing and widened rhi.SyncSlackMS from its default 10 to 20. The value is how many milliseconds before the vblank the game thread is kicked, and the engine clamps it to one frame interval, so at 60fps “20” means the full 16.7 ms. That restores GT/GPU overlap and costs that much input latency, which we could not perceive on console. The cvar only exists on platforms built with the frame-offset thread, so on PC it is not there.
If you run GTSyncType=2 on console, check whether your worst frames are closer to GT + GPU than to max(GT, GPU).
4. Build with LTCG and PGO
When you have been working on performance for a while you reach a point where there is nothing big left to optimize. What remains is thousands of small function calls, and their call overhead adds up to a measurable share of the frame.
Link Time Code Generation lets the compiler optimize across the whole executable instead of within each module, so cross-module calls can be inlined. It increases link time significantly, so it belongs on your build farm and not in local iteration.
For us, with the median frame around 60fps on console, LTCG saved a bit over half a millisecond of median game-thread time. Adding Profile Guided Optimization saved almost as much again on top of LTCG, for roughly a millisecond combined. Vsync absorbed most of the win on total frame time, so if you only look at frame time you may conclude LTCG did nothing. The visible effect for us was a few percent more frames in the same window and about six more percentage points of frames hitting 60fps.
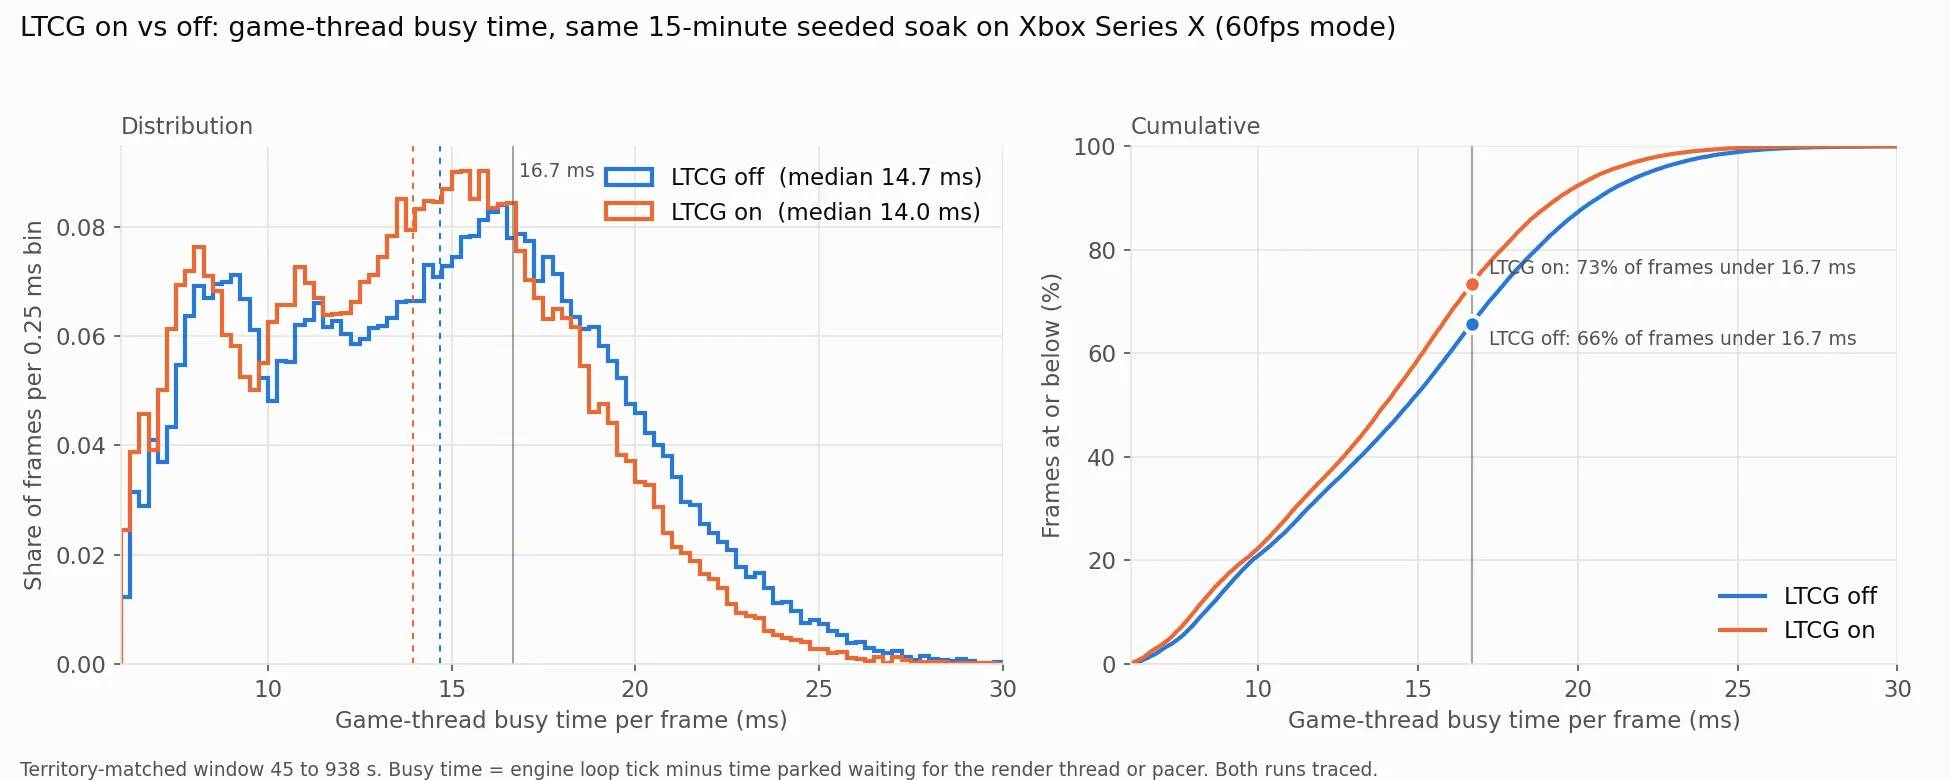 Game-thread busy time per frame over the same 15-minute seeded soak on console, LTCG off and on. The median moved from 14.7 to 14.0 ms and the whole distribution shifted left. The share of frames whose game-thread work fits inside 16.7 ms rose from 66 to 73 percent. Both runs were traced, so the tails are inflated equally.
bAllowLTCG is a UnrealBuildTool target property and is off by default. We enable it in our <Game>.Target.cs for the Test and Shipping configurations only.
PGO-instrumented builds run about 10× slower, so plan training runs accordingly. Budget a long stability soak before adopting PGO in CI. Codegen changes can shift the timing of latent races, and when our PGO binary crashed once during the A/B we had to re-symbolicate the dump and run an overnight soak before we could rule PGO out. It was an unrelated title bug. You want that answer before the flag reaches the farm.
Summary: the defaults and parameters we changed
The engine defaults and settings discussed across the four parts of this article, gathered in one place. It is a small fraction of what we changed over the project’s lifetime, only the settings that mattered for reaching 60fps and that a reader could apply directly. Each is a stock Unreal default (or stock device-profile value) that was wrong for our game. The first five rows are the ones discussed above. The rest are covered in Parts 2 and 3 in the section given. We checked the stock values against the UE 5.7 source at the time of writing. The “why” column shows our result, and yours will differ in size but probably not in direction.
| Setting | Default / stock | Ours | Why |
|---|---|---|---|
bAllowLTCG (+ PGO) |
off | on for Test/Shipping | ~1ms of median GT time combined |
r.RayTracing.Culling.Radius |
20000 (stock 60fps console profile) | 10000 | Stock profile doubled the radius, 8× the culling volume |
r.Streaming.PoolSize |
2048 (stock 60fps console profile) | 500 | Flat on frame time; reclaims memory |
wp.Runtime.LevelStreamingContinuouslyIncrementalGCWhileLevelsPendingPurgeForWP |
64 | 256 | ~75% fewer GC reachability hitches, lower peak memory |
rhi.SyncSlackMS |
10 | 20 (clamps to one frame) | Restores GT/GPU overlap under r.GTSyncType=2 |
tick.AllowBatchedTicks |
0 | 1 | Tick functions with the same prerequisites share one task instead of one task each. A small engine edit also lets skeletal mesh EndPhysics and cloth tick functions batch (Part 2, §14) |
bTickPhysicsAsync + AsyncFixedTimeStepSize |
off (variable-step, on the game thread) | on, 0.033333 | Framerate-independent vehicle handling; solver off the GT at 30Hz (Part 2, §7) |
p.aabbtree.MaxProcessingTimePerSliceSeconds |
0.001 | 0.004 | Larger worker-thread slices so static AABBTree rebuilds do not fall behind (Part 3, §19) |
p.Chaos.AsyncPhysicsStateTask.TimeBudgetMS (+ streaming Slow/Critical overrides) |
0 = no limit (engine); 7 / 15 / 30 in our PC config | 3 / 4 / 5 (console-proven) | Smaller per-frame body batches give smaller queue, build, and flush spikes (Part 3, §19) |
| GC clustering, retries, low-memory valve, and more | various | see the table in Part 3, §16 | Fewer nodes for the unsliceable reachability pass; GC scheduled through the frame budget |
| Behavior tree max tick rate (a small engine-side clamp we added, cvar-controlled) | uncapped (asset-driven, Interval=0 means every frame) |
30Hz | One eager service no longer drives whole trees at frame rate (Part 2, §8) |
VisibilityBasedAnimTickOption per mesh |
AlwaysTickPoseAndRefreshBones |
per-role (Part 3, §18) | Cut skeletal update cost by more than a third in crowds |
Anim budget allocator InitialEstimatedWorkUnitTimeMs |
0.08 | roughly doubled | Matches measured work-unit cost so throttling engages in time (Part 3, §17) |
| AI sight update interval | 0 (sweep every frame) | async physics step (33ms) | −40% sight cost; framerate-independent detection (Part 2, §8) |
Niagara PoolPrimeSize (per asset) |
0 (no prewarm) | primed on hot assets | First-spawn Init spike avoided (Part 2, §12) |
r.SkeletalMesh.DynamicDataPoolBudget |
4 MiB | 64 MiB | The pool trimmed constantly at 4 MiB, giving multi-ms Trim calls from perpetual alloc/free churn |
Slate.EnableGlobalInvalidation |
0 | 1 | Skips the invalidation precompute step and enables fastpath widget painting; no visual side effects for us |