Performance in an open-world Unreal Engine 5 game, Part 3: Keeping the work inside the frame
This is Part 3 of four. Part 1 covered the engine defaults and build flags we changed. Part 2 covered the systems that make a simulated city affordable per frame: cell streaming, spirits, fixed-step physics, rate capping, invisible physics, pooling, spawn cost and batched ticking. Part 3 is about keeping all of that inside the frame: the budget system and its failure modes, garbage collection, significance and the animation budget, streaming spikes, and work whose output was never used. Section numbering continues from Part 2. Savings are given as rough magnitudes, and everything described is in the shipping game as of writing. The console version is on Xbox Series X|S and PlayStation 5.
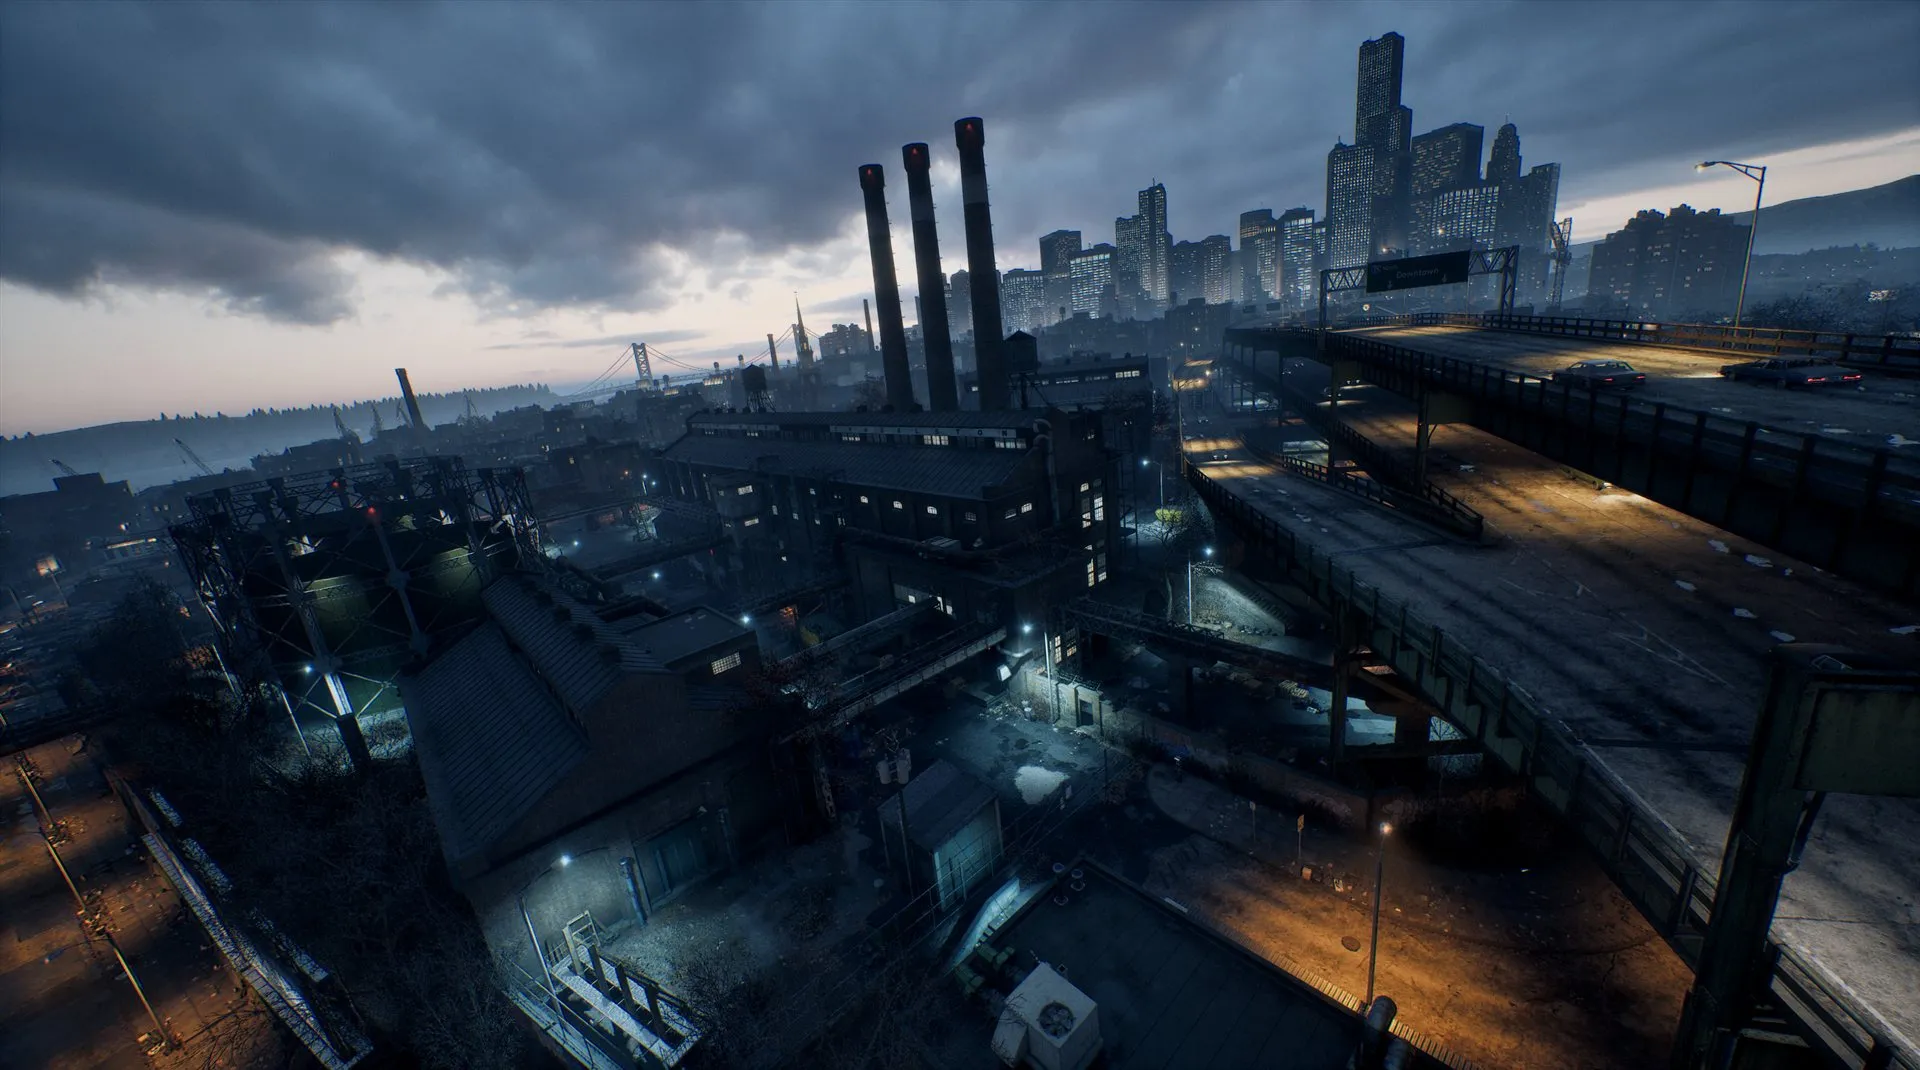 The city at night. Streaming, garbage collection, AI and spawning all compete for the same few milliseconds of frame budget.
15. A frame-time budget system must not starve its consumers
Our TimeShare system (Part 2, §5) is the reason streaming, GC, AI, and spawning together stay within a few milliseconds per frame. Three starvation pathologies had to be found and fixed, and they will exist in any similar scheduler:
- A giant request starves everyone. One system asked for nearly the entire per-frame pool. With a small unavoidable pre-spend each frame, its request never fit and it never left the head of the priority queue. Everything behind it (navigation, AI queries) was denied for hundreds of consecutive frames, which is multiple seconds. Split any request that approaches the whole pool.
- Denying a request and then queueing it locks the queue. A budget denial that earns a queue-head position converts one over-ask into a systemic lock. The fix that stuck was deferred rejections plus head aging: force-grant any head that has waited N frames. Worst-case starvation went from hundreds of frames to a handful.
- “Reported-only” spenders distort the pool. Work that reports real elapsed time without ever being admitted (an incremental GC slice, in our case, see §16) consumed the headroom every admission decision assumed was free.
The gain was in latency: total work was unchanged, but the worst “streaming makes zero progress” streaks fell from several hundred frames to about a dozen, and blocking-load triggers stopped firing.
One more property of per-frame budgets: they are per frame, but the world makes demands per second. Our 30fps quality mode drives at the same speed as the 60fps mode, with the same streaming and spawning throughput per second, but gets half as many frames to do it in, so the same budget values starved it. The 30fps presets needed roughly doubled per-frame budgets to deliver the same per-second throughput. If you ship multiple frame-rate modes, audit every per-frame budget against the rate it runs at.
For your own project: if you have any budget or scheduler system, add a one-line-per-frame summary log (grant, deny, and queue-head per consumer) and look at the longest consecutive denial run per consumer instead of the average.
16. Keeping the garbage collector inside the frame budget
GC was one of our biggest hitch sources, and no single knob fixed it. What worked is a layered model where each layer answers a different question:
- How often does GC happen? The purge timer stays at the BaseEngine.ini default of 61.1 seconds. Keep that period fractional, since a round number phase-locks with every other second-aligned periodic system and the spikes stack. The big cadence win was in Part 1, §2: stopping World Partition streaming from forcing GC many times a minute regardless of the timer. On one of the consoles we also enable the engine’s low-memory pressure valve, which is off by default (
gc.LowMemory.MemoryThresholdMB=0). When free memory drops below a few hundred MB, purge cadence tightens from 61s to 10s, accepting hitch risk when running out of memory is the bigger danger. - Which frame may it start on? This is our engine mod:
UEngine::ConditionalCollectGarbageis a TimeShare consumer (Part 2, §5). At the top of the function it requests a few milliseconds from the shared frame budget. If the frame’s pool is already spent by streaming, spawning, or AI, the entire GC step defers to a later frame. It reports its true duration afterward so the frame’s other consumers see the spend. GC stopped landing on frames that were already busy. - How much runs per frame once started? The engine’s incremental machinery. Destruction is sliced at 2ms per frame with
gc.IncrementalGCTimePerFrame, the engine default, which we pin in config so nobody has to wonder. Incremental BeginDestroy and multithreaded destruction are both on. - How big is the unsliceable core? Reachability analysis runs as one blocking game-thread block, proportional to live UObject count. For us that count moves between roughly 150,000 and 250,000 live objects depending on where the player is in the city, with 1.2 to 2.2 million references between them. The pass takes 9 to 10 ms in quiet areas and 15 to 19 ms in dense ones, on console at 60fps. Unreal does have an incremental reachability pass (
gc.AllowIncrementalReachability) that slices the walk into small per-frame pieces. While we ran it the pass cost about 2 ms a frame instead of 16 to 19 ms in one block. It is marked experimental, and Epic documents it as not thread safe: an object touched on a worker thread during the scan can be missed and collected while still in use. That makes it unusable for a game that runs parallel GC and multithreaded destruction, and we had to turn it off. Unreal really needs a production-ready incremental garbage collector. Until it has one, the only durable lever on the worst GC frame is fewer live objects: actor-stripped world geometry (Part 2, §6), pooled actors (Part 2, §12), and object clustering (below). Scheduling cannot shrink this pass, only a smaller object count can.
Both of §15’s budget pathologies show up here. The budget request is a fixed estimate but a GC frame can spike well past it, so the gate prevents starting on a busy frame but cannot cap overshoot mid-run. And once a purge is in flight, its per-frame slice runs even on frames where the request was denied, which is the “reported-only spender” again.
Our GC settings vs. the engine defaults:
| Setting | Engine default | Ours | Why |
|---|---|---|---|
gc.ActorClusteringEnabled |
False | True | An actor and its subobjects become one node in reachability, which directly shrinks the graph the unsliceable pass walks |
gc.AssetClustreringEnabled |
False | True | Same for assets. The cvar name is misspelled in the engine, and you must set the misspelled one. |
gc.NumRetriesBeforeForcingGC |
10 | 50 | More patience before a deferred GC is forced through as a blocking collect. Deferral mechanisms (async loading, our budget gate) need room to work |
gc.GarbageEliminationEnabled |
True | False | Skips per-reference garbage-elimination work during GC. The cost is that the engine no longer nulls references to garbage objects for you, so this is only safe if your code does not lean on that behavior |
gc.LowMemory.MemoryThresholdMB (one console) |
0 (valve disabled) | a few hundred MB | Low-memory mode: purge every 10s instead of 61s when headroom vanishes |
gc.AllowIncrementalReachability |
off | kept off | Experimental and not thread safe with parallel GC. We shrink the object graph instead |
gc.EnableTimeoutOnPendingDestroyedObjectInShipping |
on | False | A slow-but-healthy load could trip the watchdog and turn into a forced crash in shipping |
wp.Runtime.LevelStreamingContinuouslyIncrementalGCWhileLevelsPendingPurgeForWP |
64 | 256 | The Part 1, §2 cadence fix. Streaming stops overriding the timer |
For your own project: run with gc.DumpAnalyticsToLog=1 and answer the four questions in order: actual cadence vs. the timer, what forces off-timer collects, whether purge and destruction are sliced, and how big your blocking reachability pass is. If the last one dominates, GC tuning will not help, and the remaining work is reducing the live object count.
17. The Significance Manager, and what we scale with it
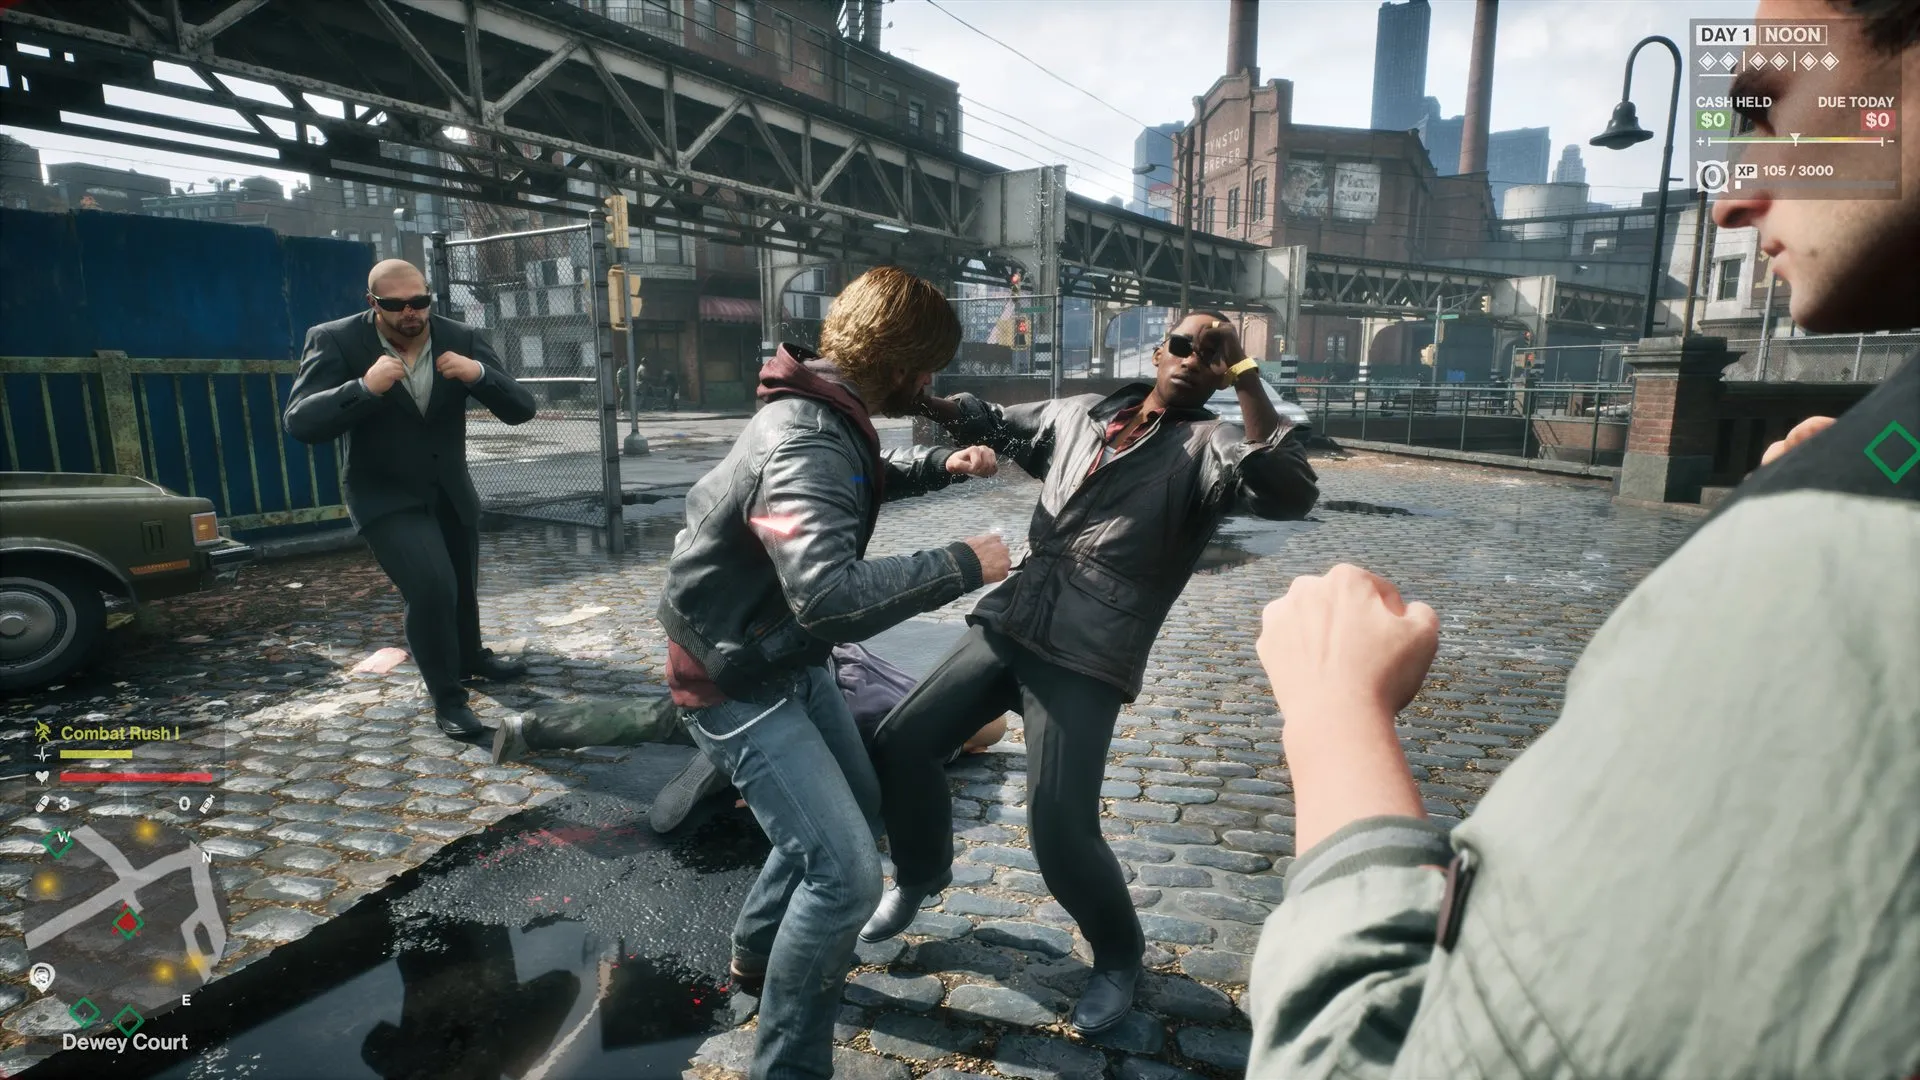 A street fight with bystanders. Significance decides which of these characters get full animation, cloth and every-frame brains, and which do not.
Unreal’s stock Significance Manager plugin is thin. It periodically calls a function you register, per object, and stores the result. All the value is in what you hang off it. We made two decisions early that everything else depends on:
- Fixed distance bands instead of a continuous falloff. Our per-NPC significance function returns one of a handful of discrete values at fixed range thresholds. Bands make every downstream consumer a small, testable switch (“band 2 = these settings”) instead of per-system thresholds that drift apart over time.
- One application point. Every consumer reads the new band in a single post-significance callback on the NPC. That gives one place to look when an NPC costs the wrong amount, and one ordering instead of scattered distance checks racing each other. The scoring pass itself is rate-capped at 30Hz (Part 2, §8).
What scales with significance in our game:
- Animation tick policy. The per-band
VisibilityBasedAnimTickOptionchoices from §18, including whether the mesh is even eligible for budget throttling. - The animation budget allocator’s priorities. More below.
- Brain rate. AI controller and behavior-tree tick intervals stretch as the band drops.
- Animation gating. Distant off-screen NPCs stop advancing animation entirely (band plus frustum).
- Anim graph ownership. At the lowest bands an NPC gives up its own anim graph entirely and joins a shared-skeleton crowd system, where one leader pose drives many followers playing generic idles and walks.
- Cosmetic simulation. Cloth and similar per-NPC extras drop out at lower bands.
- Crowd avoidance. Folded into the same bands, together with a smaller search radius, so distant NPCs stop paying for high-quality avoidance nobody can see (up to a millisecond back in dense crowds).
The animation budget allocator is the biggest significance consumer and probably the piece most teams skip. It is a stock engine plugin. You give it a fixed millisecond budget for skeletal animation, it measures per-component cost, and it degrades tick rates across the crowd, by significance, when the budget is exceeded. We register every modular NPC part (leader plus each follower mesh) as a budgeted component. How we use it:
- Treat the budget as insurance against crowd spikes. Our budgets are tight per quality tier. In a normal scene the allocator does nothing, and it does its job when a crowd spikes past the threshold, giving graceful degradation instead of a frame over budget.
- Feed it your own significance. The engine’s auto-calculated significance used a falloff so wide that every NPC scored near maximum, which is too flat to prioritize under pressure. Pushing our banded values gave it a real ranking. Also calibrate its initial work-unit cost estimate to your measured costs, or throttling engages too late. The estimate is
InitialEstimatedWorkUnitTimeMsin the parameters struct, or thea.Budget.InitialEstimatedWorkUnitTimecvar if you drive it from config. We set it from code, roughly double the engine default.
Exemptions are explicit pins. NPCs in combat keep always-ticking animation (anim notifies drive hit and damage resolution, and must fire off-screen), and the player’s dialogue partner is pinned via a player-flow flag. We also removed a “combat forces maximum significance” rule, because one big fight forced full fidelity (cloth, every-frame brains, all of it) on every distant participant. The narrow carve-outs give the same correctness with far fewer NPCs running at full cost.
The problem that came back more than once was edge-triggered application. Band changes are applied only when the band changes. A consumer that misses one edge, a component recreated mid-transition or an event arriving in the wrong order, keeps the old state. Our “frozen NPC” bug class was this shape every time. If you apply LOD state on edges, either make application idempotent and re-run it on resurrection paths, or add a periodic reconciliation pass. And build the debug tooling on day one. Console commands to dump and force a given NPC’s significance state made each of these a quick diagnosis instead of a long investigation.
For your own project: count the distinct distance thresholds scattered through your codebase. Every one is a system that will disagree with the others about how much an NPC matters. Fold them into one banded value, applied in one place.
Problems we hit with the animation budget allocator
We hit these problems getting the allocator to work for us. None of them is documented, and each cost us time.
The budget cvar does nothing in a setup like ours. a.Budget.BudgetMs looks like the knob, but the real budget arrives through SetParameters() from game code, and the cvar’s change callback overwrites it until the next quality change. As with the device profiles in Part 1, check which knob is connected before tuning it.
Editor timings are not representative. Animation work units measure far slower in editor builds, so the same budget throttles PIE much harder than a cooked build. We force a much larger budget in PIE and tune only on cooked targets.
The tick-enabled flag is unreliable while throttling. The allocator turns the engine tick function on and off every frame on its own schedule. Game code that asks IsComponentTickEnabled() mid-throttle gets a different answer from frame to frame, so we overrode it on budgeted meshes to report what the game intended.
Only register components that tick. Pure leader-pose followers, with no anim graph and no cloth, were registered anyway. Unregistering them shrank the allocator’s per-frame sort and scan from roughly 450 registered components to a bit over 100 in a busy scene. Vehicle occupants, on the other hand, had to be kept out of the budget system, because registering them re-enabled ticks we had turned off.
18. Set skeletal mesh tick options per role
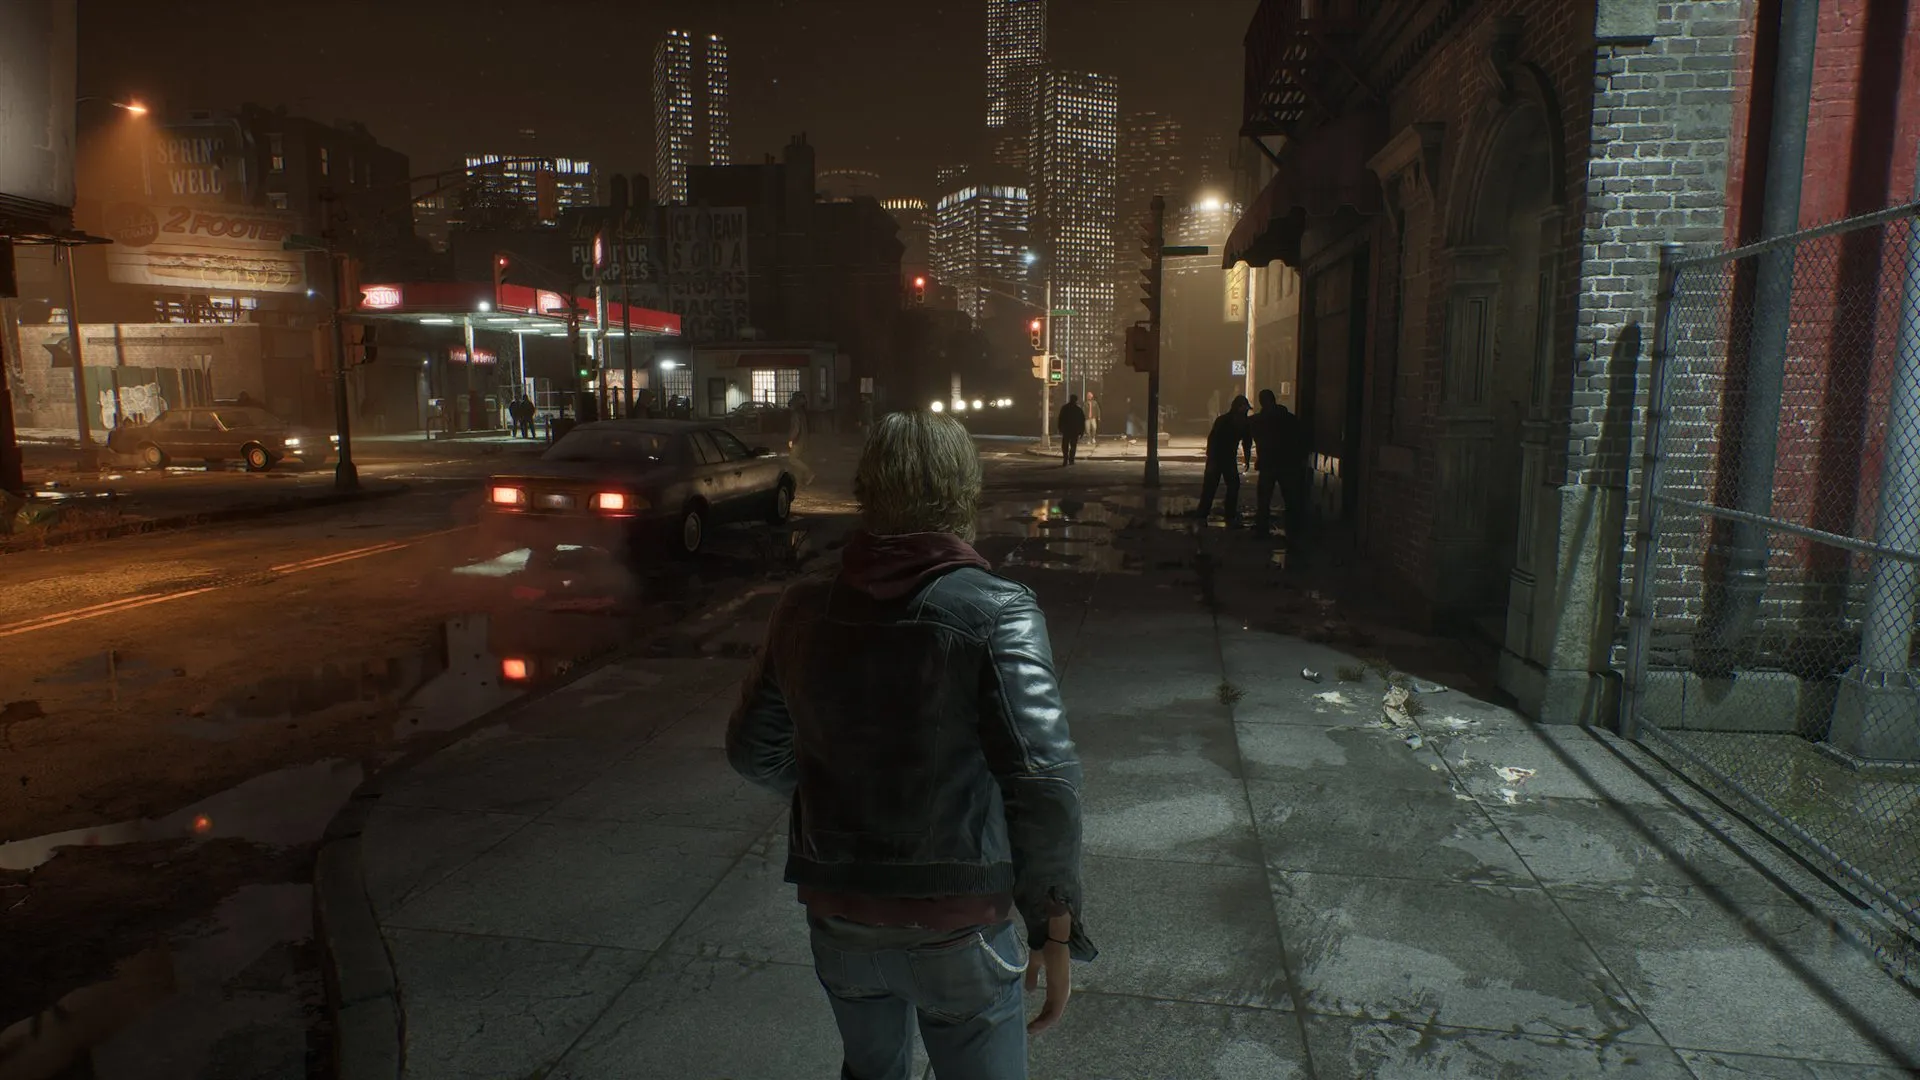 Pedestrians on a night street. Most skeletal meshes in a scene like this are off-screen or distant, and the default tick option updates all of them every frame anyway.
Skeletal mesh update was one of the biggest game-thread line items in a busy street scene, and nearly half of the per-frame mesh updates belonged to off-screen characters. With hundreds of skeletal mesh components in range (modular NPCs: one leader plus several followers each), nearly all sat on the engine default AlwaysTickPoseAndRefreshBones. That means full pose, bone refresh and render dispatch every frame, rendered or not.
We set VisibilityBasedAnimTickOption per role instead. Leaders and animated meshes get AlwaysTickPose: the pose ticks every frame so there is no wake-up hitch when the camera pans, while bone refresh and dispatch stay gated on bRecentlyRendered. Tick-disabled followers get AlwaysTickPoseAndRefreshBones, where render still only fires when the leader broadcasts. Distant NPC leaders get OnlyTickPoseWhenRendered, which is the only option that lets the animation budget allocator throttle them, since AlwaysTickPose short-circuits the budget gate. Skeletal update cost in that scene fell by more than a third, and wiring the budget allocator to our own significance bands (§17) bought another meaningful slice in crowds.
For your own project: dump the tick-option distribution across all skeletal meshes in a heavy scene (we added a console command for it). Be careful with OnlyTickMontagesWhenNotRendered. It skips the anim graph entirely off-screen, so camera pans produce a sustained multi-frame cost climb as graphs wake up.
19. Shape your streaming spikes: batch, parallelize, time-slice
Every bulk streaming operation needs three questions asked: is it batched, is it parallel, and is it time-sliced?
- Render-state recreation bursts (hundreds of components at once after PSO precache completion, inside the cell-streaming fork from Part 2, §6). We routed destroy and create through batched scene contexts instead of one-element commands per component, then parallelized the create pass with per-worker contexts. The burst roughly halved. One ordering constraint: the destroy context must flush before creates enqueue.
- The Chaos AABBTree rebuild time-slice budget, tuned from both directions.
p.aabbtree.MaxProcessingTimePerSliceSecondsdefaults to 1 ms. At that value the rebuild could not keep up with cell streaming, so the pending queue grew until it tripped a forced full build that landed as one big hitch. Our first correction was 10 ms, which overshot. The value is a ceiling on one slice, and a rebuild that fits under it completes in a single slice, so we got one fat chunk every six or seven frames instead of a spread. 4 ms was the balance point that both spreads the work and drains the queue faster than streaming fills it. Whatever value you pick, verify the forced-full-build path never fires in normal play. - Per-frame physics-body creation budgets aligned across platforms. Our PC config allowed several times bigger per-frame body-creation batches than the consoles shipped with, which produced a PC-only flush spike. Batch size per frame is the setting to tune, since it sizes the queue, the rebuild and the flush together.
- PSO precache compilation, time-sliced and demoted. A freshly streamed cell can queue long-running PSO precache tasks, and at normal priority they occupied the worker threads. That stalled the game thread second-hand, since its own offloaded tasks had nowhere to run. Time-slicing the precache work and lowering its thread priority removed the stalls. Shader precompilation is the definition of work that can wait a few frames. Completion fires one small game-thread task per pipeline, so we batch prerequisite-free completions into a single task. During a blocking load we drain the precache queue immediately, so the loading screen cannot release before the shaders behind it are ready.
- Hunt PSO precache misses as well as precache cost. Precaching only prevents hitches for pipelines it covered, and a miss is a one-off hitch that looks like random noise. A dedicated hunt found whole categories the precache pass skipped: Slate, landscape ray-tracing geometry, Nanite Lumen cards, and a bug where materials were collected from the wrong LOD level for Nanite meshes (which always render LOD 0). Each fixed category removed a family of unexplained single hitches.
- Navmesh tiles registered incrementally. Navigation tiles arriving with streamed chunks used to register in one burst. Capping tiles per frame and paying for them out of the same remaining frame budget as level streaming spread the cost invisibly.
- Preload the known stragglers. Some assets are always needed shortly after a cell loads but are not referenced by it (interior reflection cubemaps were ours). A small per-world preload list, loaded with the level and kept pinned, converts a mid-gameplay load hitch into loading-screen time.
- GPU buffer allocation has hitches too. Large upload-buffer allocations (Nanite streaming was the trigger) forced new backing memory to be allocated on the critical path. Pre-allocating overflow pools on a background thread, and sizing the big-block pool so the common case never allocates, removed a hitch class that no game-thread profiler will attribute correctly.
For your own project: for each streaming-driven burst, find the knob that sets work admitted per frame. That one knob usually controls three downstream spike sizes at once.
20. Lazy-create debug-only components
A small one, but it showed up in every capture as a spawn spike of tens of milliseconds, once per session. A combat-debug stun indicator created and registered a UTextRenderComponent in every character’s BeginPlay. The debug feature is off by default, and nothing else in the game used that component type, so the first NPC to spawn paid the full first-use render-resource cost for a component nobody would ever see. Creating it on first use was a few lines and removed the spike.
For your own project: grep your BeginPlay implementations for NewObject plus RegisterComponent on anything gated behind a debug flag. Each one adds to spawn time for a feature that is off in shipping.
21. Platform calls that block the game thread
Saving the game produced a tenth-of-a-second game-thread hitch on exactly one platform. SaveGameToSlot is near-free on PC, but on some consoles each call is a full savedata transaction (mount, icon write, polled write, unmount and commit). Our save path called it twice, synchronously, on the game thread. Switching to AsyncSaveGameToSlot, where the engine runs the platform call on a background pipe, removed the hitch, and the “game saved” toast now appears when the write completes. Platform save systems keep mount state, so sync and async calls must never overlap. We drain the async pipe before any remaining synchronous save-system call.
The same thing happened in the UI. An input-device change (gamepad re-enumeration, Steam Input flips) broadcast from inside the OS message pump synchronously rebuilt every input-glyph widget, including several full asset-registry scans, for a multi-millisecond spike. The fix was to coalesce the rebuilds into a one-shot deferred tick outside the pump, and cache the asset scan per session.
For your own project: time every platform-API call on your slowest target platform, since your dev machine will hide the cost, and audit what work runs synchronously inside OS event broadcasts.
22. Remove work whose output is never used
The waste we kept finding came in two forms, and neither shows as a hotspot. They show as many small costs spread across the frame.
Loops that scan for rare events. Our interaction-icon manager iterated about 700 pooled entries every frame to find the roughly 7 in player range, over half a millisecond of almost pure early-outs. The fix was to invert it: subscribe to a range-changed event and touch only the entries that changed. The same pattern repeated three more times. Minimap icons were updated per frame and now update on change. A view-data broadcast fired even when the state being set was the state it already had. An event handler received a specific handle as its argument, ignored it, and scanned both icon pools in full anyway. A loop that mostly early-outs still pays the iteration and the cache misses. When the event is rare, subscribe to it instead of polling for it.
Create things when they are needed. The same icon system kept about 3,200 pooled HUD icon widgets (each with its own material instance) alive at all times for the roughly 30 ever on screen. Acquiring them only when in range cut that a hundredfold. A controller help screen built about 490 input-icon widgets up front for the roughly 80 visible. Pools and caches are for things you will need soon, sized by peak concurrent use and not by everything that could exist.
Work whose output nothing reads. The Chaos vehicle component was updating parameters for multiplayer network synchronization in a single-player game. The engine enqueued a SpeedTree wind render command every frame, with no SpeedTree content in the game. A per-agent environment-context update fed a consumer that had been removed long ago. These survive because they are individually small and nothing fails when they run.
For your own project: for each per-frame call in your managers, ask who consumes the result. Profilers make loops visible, but nothing flags a live loop with a dead output. The only way we found them was by reading the code.
23. Micro-optimizations still add up in per-frame managers
Nearly every per-frame manager we profiled had a few of these, and none of them is worth a section on its own. Together they added up to a measurable share of the frame. One typical example: a subsystem ticking a few hundred audio emitters per frame got about a third cheaper with three changes of this kind:
- Delete a defensive per-frame
TArraycopy that nothing mutated. - Flatten a sort comparator that did two map lookups per compare. Cache the pointers into an inline buffer once, sort that, write results back.
- State-gate a per-object engine call (
SetComponentTickEnabledAsync) behind a cached “did the answer change” bool, since most objects are stable frame-to-frame.
For your own project: any manager that loops over hundreds of objects per frame deserves ten minutes with a profiler, looking specifically for per-iteration allocations, per-compare lookups, and redundant engine calls with unchanged arguments.