Performance in an open-world Unreal Engine 5 game, Part 4: The process: experiments and the weekly meeting
This is Part 4 of four. Part 1 covered the engine defaults and build flags we changed, Part 2 the systems we built to make a simulated city affordable on a 16.7ms game-thread budget, and Part 3 how we kept that work inside the frame. Part 4 is the process behind all of it: how we ran the experiments, the rules that kept wins we could not prove out of the earlier parts, and the weekly meeting that kept performance from drifting back. The console version is on Xbox Series X|S and PlayStation 5.
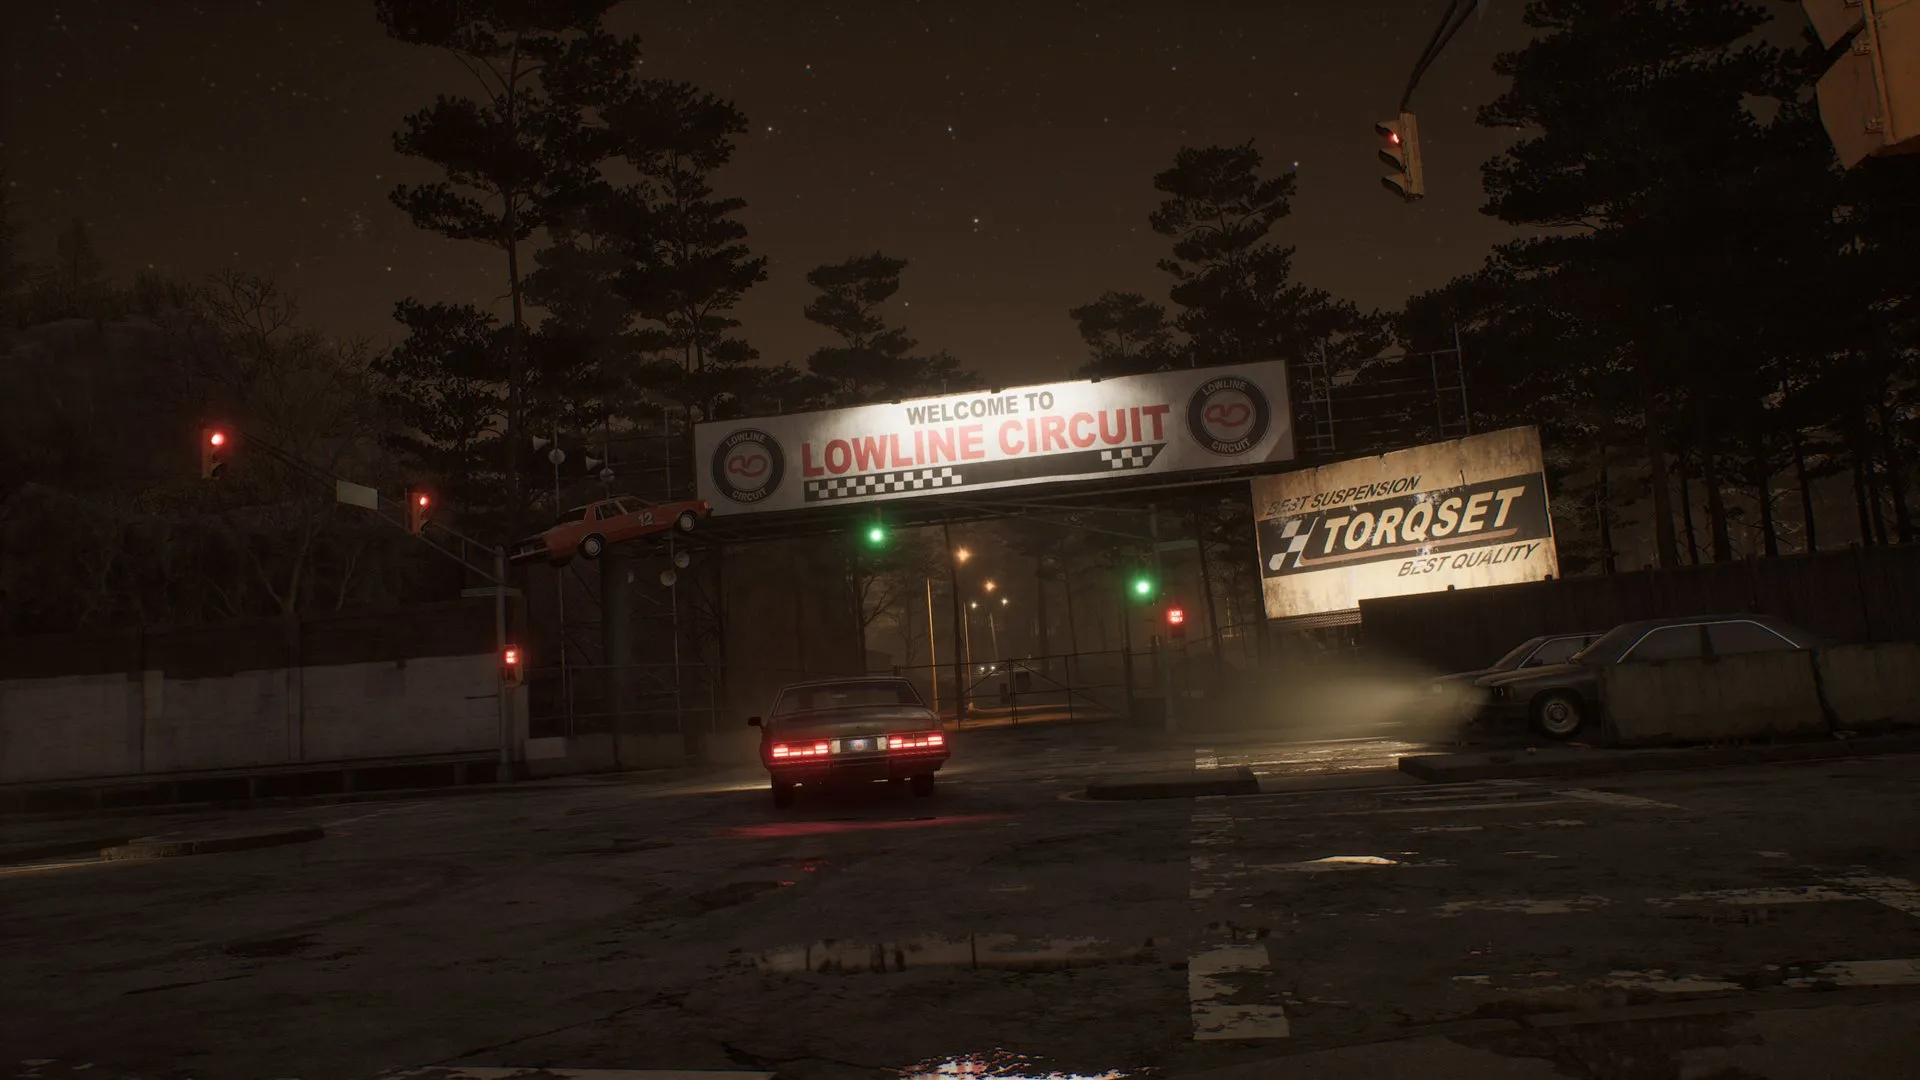 A night road in the city. On a seeded soak the car drives itself along roads like this while the frame-time distribution is recorded.
More of our time went into measurement than into fixes. Our standard instrument is a seeded soak: an automated 5 to 15 minute drive on the target console, with the player as a passenger in a car that follows a route chosen from a fixed random seed. Two runs with the same seed drive the same roads in the same order.
The setup is simple enough to describe in one paragraph. We use Unreal’s own Gauntlet automation framework for it. Our soak and flythrough controllers derive from the Gauntlet plugin’s test controller class. The C# test nodes that launch, monitor and collect the runs on console sit alongside the build scripts, so the same tests run from a developer’s desk and from the build farm. A test controller drives the route, and the seed is a cvar so a run can be repeated from a launch line. The game launches with vsync and the frame limiter off, AI logging off and GC verification off, and with an Insights trace going to a host PC. Analysis starts about 45 seconds in, after the initial load has settled, and covers a window matched between runs by territory instead of by wall clock (rule 4). The numbers we compare are game-thread busy time at the median, 90th and 99th percentile, the percentage of frames under 16.7 ms, and the total frame count in the window. Busy time is the engine loop tick minus the time spent waiting for the render thread or the pacer. Systems that admit work through the frame budget also write a one-line-per-frame summary to the log, which is how the starvation cases in Part 3, §15 were found.
On top of that, ten rules we follow on every experiment:
- A/B with the frame limiter and vsync off. Under vsync, a real sub-millisecond win shows up as “median unchanged” because the pacer absorbs it. Uncapped, two identical runs differ by a few hundredths of a millisecond at the median, an order of magnitude below the effects we were chasing. With vsync on, the same pair of runs differs by a quarter of a millisecond, which is larger than most of the wins in this series.
- Establish the noise floor first. Run the same configuration twice before crediting any delta. One metric we chased, the percentage of frames with wasted time, read 4.5 in one baseline and 7.4 in the identical repeat, while the fix under test scored 4.6. That experiment could not have answered the question whatever the change did. Tail metrics need the same care: a five-minute run contains only one or two of the events that make up the tail, so the median floor says nothing about them.
- Same binary, cvar-gated arms. Two-binary A/Bs confound the result, and are only unavoidable for link flags (Part 1, §4). Put the change behind a cvar, prove the control arm reproduces the defect, then compare.
- Territory-match your windows. Open-world content varies a great deal from one stretch of road to the next. The seed fixes the route, and two runs are on the same road at the same second. Traffic and pedestrians are still random, so the same wall-clock window can cover a quiet road in one run and a crowded one in the other. We once compared two runs over the same 50 to 330 second window and saw a 2 ms regression at the median, and several per-entity counters agreed with it. Matching heavy territory to heavy territory made the regression disappear. The same stretch of road had been nearly empty in one run and dense with traffic in the other. Better still, seed everything that is randomized, so two runs with the same seed see the same traffic as well as the same road.
- Verify each arm exercised the change. Device profiles, other cvars, world-init code, or stale deploys override your lever without telling you. World Partition, for example, rewrites the streaming GC cvars at world init, after startup has applied your value (Part 1, §2). An arm whose lever did not engage is invalid.
- Know your profiler’s overhead and its artifacts. Our worst “monster spikes”, 40 ms materialization frames in Part 2, §5, were trace-backpressure artifacts. Untraced runs with a wall-clock probe showed nothing close to that size. The two profilers we use also cost different things. Insights tracing with named events left the median untouched and added about 5 ms at the 99th percentile, a tail-only cost. An attached sampling capture added about 2 ms to the median. Deltas between two captured runs are still valid. Absolute numbers from a captured run are not.
- One hypothesis per fix attempt, and revert what does not move the metric. Stacked speculative changes make the eventual win unattributable.
- Elimination is not observation. “It must be X because I ruled out Y and Z” caught us more than once, and a direct probe of X refuted it. Instrument the mechanism before writing the fix.
- Corroborate frame-time deltas with structural counters. A fraction-of-a-millisecond median claim is noise-limited. “Hundreds of thousands of sync moves removed, matching an independent probe’s count within a couple of percent” is not, and that is how the hibernated-car fix in Part 2, §10 was confirmed.
- Pre-register the experiment. Metric, baseline, arms (including a true no-change control), and the numeric win threshold, written down before the runs.
Telemetry from test machines and development builds
Soaks and flythroughs tell us how the game runs on our hardware, on our routes. Telemetry collects the same kind of numbers from every development and test build that runs, on the test farm, on developer machines and on QA machines, with nobody starting a profiler. We used it throughout development as the source of the metrics behind our performance decisions. We built our own pipeline for it early in the project. The server side is in-house, built on an embedded analytics database, and it drives the dashboards that the weekly meeting reads and the screen on the office wall.
The client side is an engine subsystem with a dispatch thread. Game code calls a send function with a channel name and a flat set of strings and numbers. The call puts the record on a queue capped at a few thousand entries and returns. The dispatch thread posts records over HTTP with a short timeout, so a slow or missing connection does not block the game thread. An event’s schema is never changed once it is in use, because older builds on the farm and on test machines keep sending the old shape. If a field has to be added, the event gets a new name with a number on the end, so our channels have names like FrameTimings2 and StartupInfo3. Events are also sent when something changes instead of every tick. Periodic data is aggregated on the client and sent as one record per interval.
The server controls what is sent. At startup the client fetches an event configuration keyed by its client id and build configuration. The configuration lists, per channel, whether it is enabled and its maximum send rate. In test builds a channel that is not listed is not sent, and development builds send everything. That gives us a switch and a rate limit on the server for every event in every build on the farm, without a rebuild.
What the builds send about performance:
- Hardware, once per session. GPU and CPU model, core count, OS version, RAM, dedicated video memory, and the engine and build versions. Every other number can be split by these.
- The hardware benchmark result whenever the engine’s synthetic benchmark runs, so we can see what quality tier the autodetect chose and what score led to it.
- Frame timings, one record every ten seconds of play. The client tracks every frame and sends the count, the median, and the worst frame in the interval together with the game-thread, render-thread, RHI-thread and GPU times on that frame. It also sends a histogram of frames above 17, 25, 34, 40, 50, 60, 75, 100, 150 and 250 ms. The thresholds are chosen so a 60fps target, a 30fps target and hitches of increasing severity each get their own bucket.
- World and memory state, once a second by default. Live UObject count, actor count, moving and total physics bodies, and used physical and virtual memory. This is where the object-count numbers in Part 3, §16 come from, and it is how the weekly meeting watches memory and object trends over months.
- Player position at a configurable rate. Position and rotation in the world, which turns every other event into a map. Frame-time histograms plotted by position are how “bad places in the world” reach the agenda.
- Materialization cost for characters and vehicles, split by LOD phase, so the spirit system’s most expensive step (Part 2, §5) is measured on real hardware and real content.
- Video memory pressure events when the game detects it is over its VRAM budget and when it resolves, with the adapter name.
The test farm sends the same events with a test name attached, plus one more: frame time at position along each flythrough route. That is the data behind the per-platform flythrough reports the meeting reviews.
Because the client aggregates, we see distributions and never a single frame. If a question needs a trace, it has to be reproduced with Insights attached.
For your own project: version every event and never change one in place. Put the on and off switch for each channel on the server so it can be changed without a rebuild. Send hardware once and everything else aggregated, and always include position, because a frame-time number without a location is much harder to act on.
Screens in the office
Around the office we have screens that always show two things: the state of the build and the number of ticking UObjects in the game. Nobody has to open a dashboard or ask in a channel. Anyone walking past can see whether the game is in a working state, and if it is not, which platforms are not running as they should and whether the failure is in compilation or in the automated smoke tests.
The ticking UObject count is on the screen for a reason. Every ticking object is game-thread work each frame (Part 2, §14), and the count moves when someone adds a ticking component to a common actor or a spawner starts leaking objects. A step in that line is visible to the whole team the same day it happens, long before it would surface as a slower median in a soak.
For your own project: put the build state and one or two performance numbers where people cannot avoid seeing them. A number that everyone glances at several times a day gets noticed when it moves. A number in a dashboard gets noticed when someone remembers to look.
The weekly performance meeting
The rules above are about single experiments. What kept performance moving over two years was a standing weekly meeting with a fixed agenda, held from June 2024 through to the console release, 88 meetings in all. It did not try to solve anything in the room. Its job was to look at the same numbers every week and turn what they showed into actions with a name attached.
The agenda did not change much over that time:
- Review the actions from last week. Every item carries an owner in parentheses and stays on the list until it is done or dropped. Items do carry over for weeks, and that is fine, as long as nothing drops off the list without a decision.
- Are all the consoles still running? The automated soaks run on every target platform, and the first question is whether the test farm itself is healthy. A devkit that has stopped running produces a flat line, which is easy to misread as a stable week.
- Framerate, memory and object trends. One dashboard with the soak results per platform and quality mode, plotted over weeks. We look at the trend over weeks instead of the latest point, and a step in the graph is a prompt to find the changelist that caused it.
- Loading speed. Load times per platform from the same runs, on their own dashboard because they regress independently of frame rate.
- Last build’s flythroughs: hitches and CPU and GPU budgets. A fixed set of flythrough routes runs on each platform and on two PC configurations. The report for each run gives frames over budget, hitch counts and the per-system CPU and GPU budgets. A typical note from the log reads “still 800 frames above 16 ms on console in performance mode”, and a typical action is “retune the pool sizes” with a name after it.
- Memory profiling jobs. Low-level memory tracking runs on the consoles are reviewed separately, because they show which system allocated the memory, which the soak trend cannot.
- New issues from QA, and bad places in the world. Anything QA found by hand, and any location where the automated routes or players hit a hitch or a frame-rate hole.
- Summarize the actions for next week.
Who was in the room mattered more than the agenda. The meeting had project buy-in from the start, and the same people attended every week: the technical director, the lead render programmer, a technical artist and the lead QA. With them present, a number on a dashboard could be turned into a task, given an owner and prioritized on the spot, outside the normal sprint schedule, without a second meeting to get approval.
Everything on the agenda is a link to something automated. The data comes from three places: the telemetry system, the automated soak-test machines and performance dumps from Unreal itself. Nobody prepares slides, and the meeting is only as good as the automated runs behind it, which is the reason item 2 comes first.
The log is kept in the code documentation next to the profiling guides, one heading per meeting with the comments and actions underneath. When a number moves, a search of the log shows what was tried before and who looked at it.
For your own project: put the meeting on the calendar before you have the dashboards, and let the agenda drive which dashboards get built. Get the people who can approve work into the room, or the meeting produces observations instead of tasks. Ours started with two links and grew to seven. Keep the actions short, owned and carried forward, and keep the log somewhere the engineers already look.
Thanks
The work in these four parts was not one person’s. Lars Sjödin, Robin Krokfors, Phil Adams and Martin Svärd were all part of the active performance effort described here. Thanks to them, and to the rest of Liquid Swords, who helped whenever it was needed.